Amazon Shopping Reviews
This repository contains a personal project focused on automating the entire data pipeline, from data ingestion from Kaggle to visualization in Power BI. The primary goal is to automate the entire process, while a secondary objective is to visualize insights.
Description
Project Description: This project aims to automate the entire data pipeline, from daily ingestion of the latest Amazon Shopping Reviews dataset on Kaggle to real-time visualization in Power BI. The dataset includes reviews and ratings of the Amazon Shopping app, which is updated daily.
Objetives
- Primary: Automate the data flow from daily Kaggle updates to Power BI visualization.
- Secondary: Enable real-time data visualization to support data-driven decisions for improving the Amazon app and enhancing the customer experience.
Data
The project will utilize a Kaggle dataset stored in a single CSV file:
- User ID
- User Name
- Comment
- App rating
- Comment date
- Comment time
- App Version

Project Plan:
- Create a SQL Server database to store the data.
- Download the dataset into SQL Server and conduct an exploratory analysis.
- Identify relevant and irrelevant columns.
- Identify null, missing, and duplicate values.
- Develop a Python automation script based on the gathered information.

Key Report Conclusions
Exponential User Growth
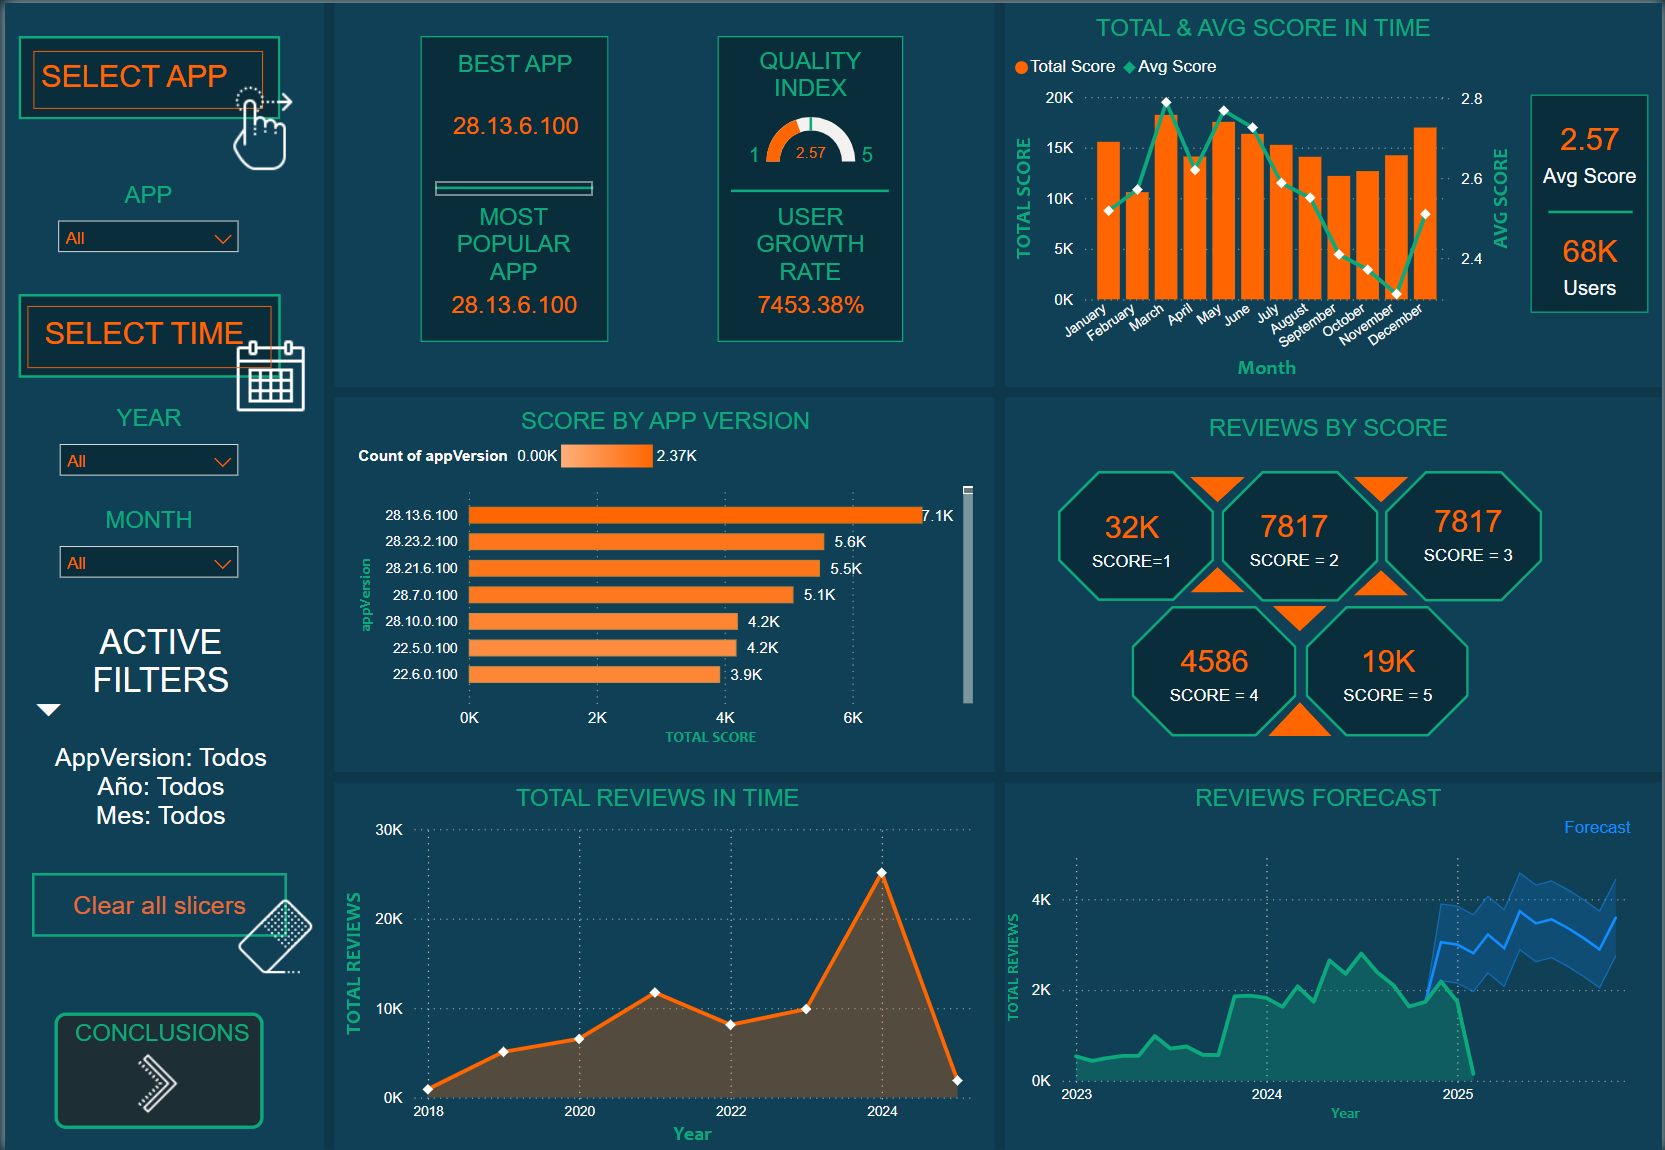
- From 2018 (with 918 users) to early 2025 (68,000 users), the growth has been 7453.28%.
- This increase is attributed to the rising demand for online shopping and improvements in the applications.
Evolution of Reviews and Their Impact
- Over time, the number of reviews has increased due to multiple factors, such as logistics advancements and user trust in the delivery service.
- The projected trend indicates that reviews will continue to rise with 99% confidence, according to the Exponential Smoothing (ETS) model in Power BI.
Application Quality
- Measured by the Avg Score. If an application has a score above 3, it is considered of good quality.
- There are fluctuations in quality, such as a drop in the average score in November, which may indicate app failures or user preference for previous versions.
Differences Between "Best App" and "Most Popular App"
- "Best App": The application with the highest score based on user reviews.
- "Most Popular App": The one with the highest number of users.
- In 2019, 2021, and 2022, these metrics did not match, suggesting that the most widely used app is not always the highest-rated.
User Rating Trends
- The majority of reviews are critical, while opinions where the app met expectations rank second.
- Ratings of 2, 3, and 4 stars are indistinct, indicating that users tend to polarize their opinions (either very positive or very negative).
Logistics and Customer Experience
- Improvements in traceability, delivery time, and product condition have strengthened user trust in online shopping.
- This has driven both user growth and the number of reviews.
Top Applications
- The best-rated application achieved a score of 7100.
- The most commonly used versions in the market are Version 28.
Final Conclusion
The report clearly shows the evolution of Amazon applications, driven by increasing online shopping demand and trust in delivery services. A strong relationship is observed between user growth, review volume, and application quality perception. In the future, the trend suggests that both user numbers and reviews will continue to rise.